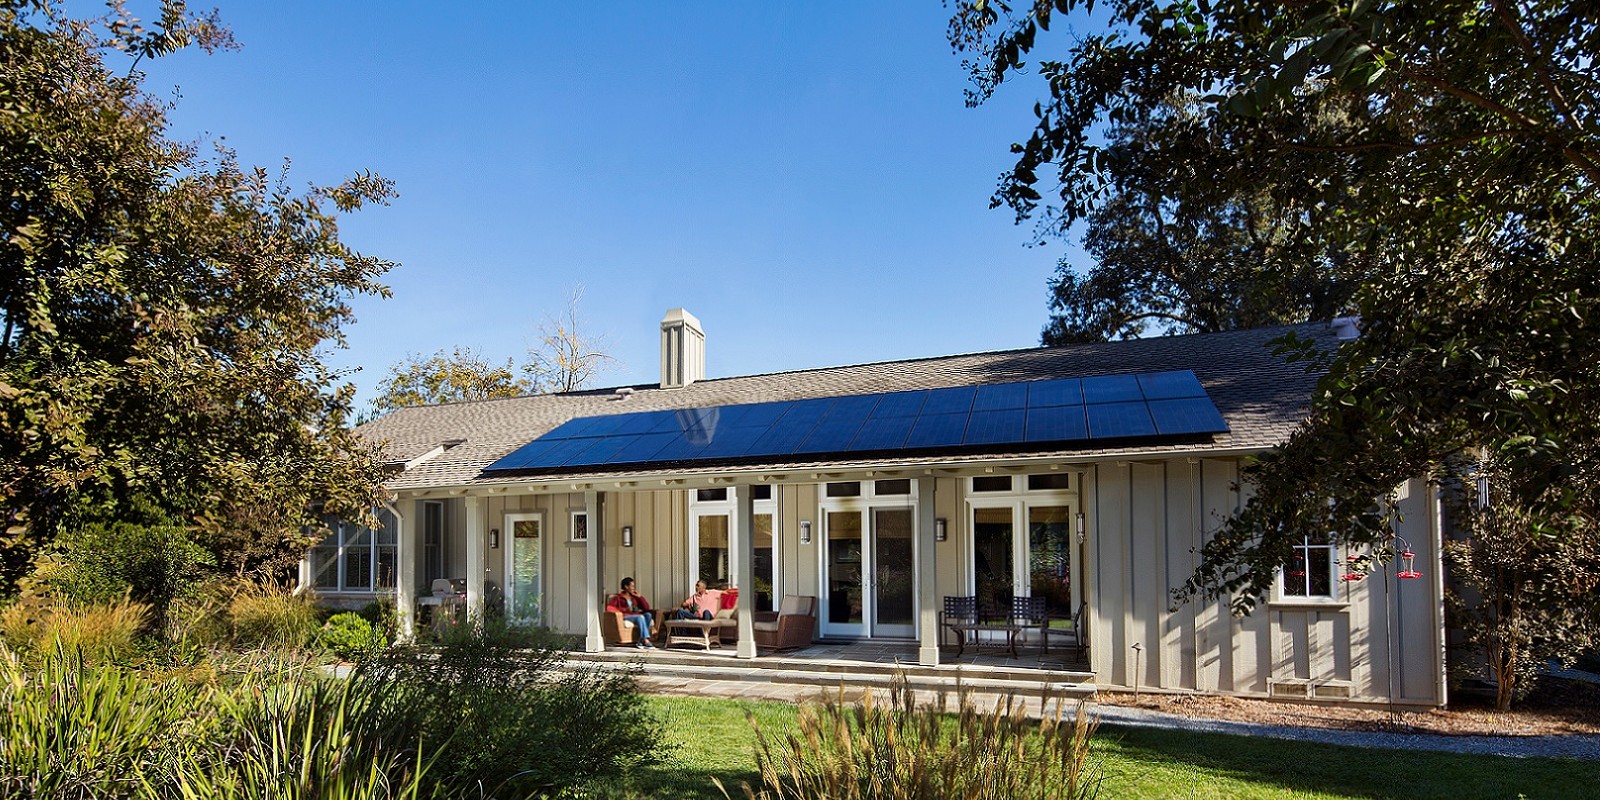
Here’s how US rooftop solar adoption breaks down by income – it might surprise you

Lawrence Berkeley National Laboratory (LBL) analyzed roughly 2.8 million residential rooftop solar systems installed through 2021, representing 86% of all US systems. Here are the latest trends based on income among American solar adopters, according to the data.
The post Here’s how US rooftop solar adoption breaks down by income – it might surprise you appeared first on Electrek.

Lawrence Berkeley National Laboratory (LBL) analyzed roughly 2.8 million residential rooftop solar systems installed through 2021, representing 86% of all US systems. Here are the latest trends based on income among American solar adopters, according to the data.
LBL’s annual report, “Residential Solar-Adopter Income and Demographic Trends,” looks at solar adopter trends in such categories as household income, education, occupation, age, and location within a “disadvantaged community.”
As a whole, researchers found that, compared to the broader population, solar adopters tend to: identify as Non-Hispanic White, be primarily English-speaking, have higher education levels, be middle-aged, work in business and finance-related occupations, and live in higher-value homes.
The latest findings show that solar households span across all income levels. For example, around one-third of all households that installed solar in 2021 had incomes between $50,000 and $100,000. About half were above that range, and 15% of adopters were below that range. The largest percentage fell into the $75-100,000 range, and the $50-75,000 range was the second-highest percentage.
Median solar adopter annual income for 2021 was about $110,000 in 2021, compared to US median annual income of about $63,000 for all households and $79,000 per year for all owner-occupied households.
The data also looks at “disadvantaged communities.” The US Department of Energy developed a designation for disadvantaged communities (DACs) that considers a diverse set of criteria related to energy burden, environmental and climate hazards, socioeconomic vulnerabilities, and fossil fuel dependence. The percentage of residential solar installations in DACs more than doubled from 5% in 2010 to 11% in 2021. But DACs make up 18% of US households as a whole, so they still remain under-represented relative to their share of the population.
Read more: Could rooftop wind give rooftop solar a run for its money?
UnderstandSolar is a free service that links you to top-rated solar installers in your region for personalized solar estimates. Tesla now offers price matching, so it’s important to shop for the best quotes. Click here to learn more and get your quotes. — *ad.
FTC: We use income earning auto affiliate links. More.
Subscribe to Electrek on YouTube for exclusive videos and subscribe to the podcast.
