Current EV registrations in the US: How does your state stack up and who grew the most YOY?
As many legacy automakers join a slew of new and established EV manufacturers in committing to an all-electric future for passenger vehicles, the transition for consumers continues to rise. While we are still quite a ways away from a world of roads dominated by BEVs, the graph of this transition continues to trend upward. Below is where the US currently stands in total EV registrations, broken down state by state. We’ve also compared last year’s results to see how far your state has grown.
Table of contents
How the data was gathered
To determine the number of EV registrations in the US, we consulted data from the Alternative Fuels Data Center (AFDC) through the US Department of Energy website.
The data was last updated in June of 2022 and represented all registered EVs in the US as of December 31st, 2021. For that reason, we are comparing our data from 2020 registrations to 2021. In 2023, we will update this list again and compare YOY growth with 2022 registrations.
Note that this data includes BEVs only and does not account for any hybrids or PHEVs.
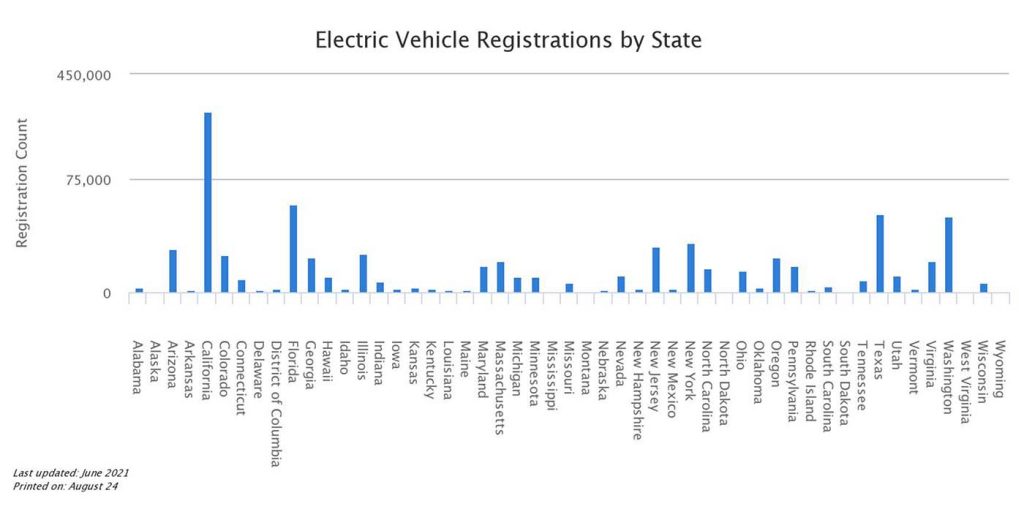
Current EV registrations in the US, sorted by state
State
# of EV registrations (2020)
Percent of total EVs (2020)
# of EV registrations (2021)
Percent of total EVs (2021)
YOY Growth
Alabama
2,890
0.30%
4,750
0.33%
+64.40%
Alaska
940
0.09%
1,290
0.09%
+37.23%
Arizona
28,770
2.80%
40,740
2.80%
+41.61%
Arkansas
1,330
0.13%
2,390
0.16%
+79.70%
California
425,300
42%
563,070
38.71%
+32.40%
Colorado
24,670
2.4%
37,000
2.54%
+50.00%
Connecticut
9,040
0.90%
13,350
0.92%
+47.70%
Delaware
1,950
0.20%
3,010
0.21%
+54.40%
District of Columbia
2,360
0.23%
3,700
0.25%
+56.80%
Florida
58,160
5.7%
95,640
6.58%
+64.44%
Georgia
23,530
2.3%
34,020
2.34%
+44.58%
Hawaii
10,670
1.1%
14,220
0.98%
+33.30%
Idaho
2,300
0.23%
3,500
0.24%
+52.20%
Illinois
26,000
2.6%
36,520
2.51%
+40.50%
Indiana
6,990
0.70%
10,360
0.71%
+48.21%
Iowa
2,260
0.22%
3,660
0.25%
+62.00%
Kansas
3,130
0.31%
4,500
0.31%
+43.77%
Kentucky
2,650
0.26%
4,220
0.29%
+59.30%
Louisiana
1,950
0.19%
3,180
0.22%
+63.10%
Maine
1,920
0.19%
3,040
0.21%
+58.33%
Maryland
17,970
1.8%
25,630
1.76%
+42.63%
Massachusetts
21,010
2.1%
30,470
2.09%
+45.03%
Michigan
10,620
1%
17,460
1.20%
+64.41%
Minnesota
10,380
1%
15,000
1.03%
+44.51%
Mississippi
780
0.08%
1,310
0.09%
+68.00%
Missouri
6,740
0.66%
10,050
0.69%
+49.11%
Montana
940
0.09%
1,650
0.11%
+75.53%
Nebraska
1,810
0.18%
2,710
0.19%
+49.72%
Nevada
11,040
1.1%
17,380
1.19%
+57.43%
New Hampshire
2,690
0.26%
4,000
0.28%
+48.70%
New Jersey
30,420
3%
47,830
3.29%
+57.23%
New Mexico
2,620
0.26%
4,150
0.29%
+58.40%
New York
32,590
3.2%
51,870
3.57%
+59.16%
North Carolina
16,190
1.6%
25,190
1.73%
+55.60%
North Dakota
220
0.02%
380
0.03%
+72.73%
Ohio
14,530
1.4%
21,200
1.46%
+45.91%
Oklahoma
3,410
0.34%
7,180
0.49%
+111.00%
Oregon
22,850
2.2%
30,290
2.08%
+32.60%
Pennsylvania
17,530
1.7%
26,770
1.84%
+52.71%
Rhode Island
1,580
0.16%
2,550
0.18%
+61.39%
South Carolina
4,390
0.43%
7,440
0.51%
+69.50%
South Dakota
410
0.04%
680
0.05%
+66.00%
Tennessee
7,810
0.80%
12,160
0.84%
+55.70%
Texas
52,190
5.1%
80,900
5.56%
+55.01%
Utah
11,230
1.1%
16,480
1.13%
+46.75%
Vermont
2,230
0.22%
3,370
0.23%
+51.12%
Virginia
20,510
2%
30,660
2.11%
+49.50%
Washington
50,520
5%
66,810
4.59%
+32.30%
West Virginia
600
0.06%
1,010
0.07%
+68.33%
Wisconsin
6,310
0.62%
9,330
0.64%
+47.90%
Wyoming
330
0.03%
510
0.04%
+54.60%
TOTAL
1,019,260
100%
1,454,480
100%
+42.70%
Numbers recent of December 31st, 2021
Source: Vehicle registration counts derived by the National Renewable Energy Laboratory with data from Experian Information Solutions
Top three states with the most registered EVs (as of 12/31/21)
California – 563,070 (+137,770 EVs YOY)
Florida – 95,640 (+37,480 EVs YOY)
Texas – 80,900 (+28,710 EVs YOY)
It’s no wonder that these top three states have the most registered EVs since they have some of the highest state populations in the US. They also have some of the highest numbers of registered ICE vehicles and trucks in the US too.
Bottom three states for registered EVs (as of 12/31/21)
North Dakota – 380 (+160 EVs YOY)
Wyoming – 510 (+180 EVs YOY)
South Dakota –680 (+270 EVs YOY)
The bottom three states showcase a similar, yet inverse pattern. These are states with smaller populations and thus fewer vehicles on the road. That being said, Washington D.C. has more than double the number of registered EVs of all three of these states combined.
Despite abysmal numbers in these states, their year-over-year numbers are still encouraging. Each saw at least 54% growth and North Dakota lead this group with a 72.73 % increase YOY.
Top three states who saw the most growth year-over-year (2020 vs 2021)
Oklahoma (+111% YOY)
Arkansas (+79.70% YOY)
Montana (+75.53% YOY)
Overall, EV adoption in the US is growing, state by state, and these numbers above help prove it. Overall EV registrations were up over 42% in 2021 compared to 2020, and every state saw YOY growth of at least 32%, although most were much higher.
Because this data pertains to 2021, we are confident we will see even larger growth when comparing 2022 numbers as the US has recently surpassed the 5% threshold of EV share of the entire market, a number many have labeled as the critical mass tipping point for widespread adoption.
We will need to get through 2022 before we can compare those numbers, but in the meantime, here are some resources to help keep you in the know:
Subscribe to Electrek on YouTube for exclusive videos and subscribe to the podcast.
As many legacy automakers join a slew of new and established EV manufacturers in committing to an all-electric future for passenger vehicles, the transition for consumers continues to rise. While we are still quite a ways away from a world of roads dominated by BEVs, the graph of this transition continues to trend upward. Below is where the US currently stands in total EV registrations, broken down state by state. We’ve also compared last year’s results to see how far your state has grown.
Table of contents
How the data was gathered
To determine the number of EV registrations in the US, we consulted data from the Alternative Fuels Data Center (AFDC) through the US Department of Energy website.
The data was last updated in June of 2022 and represented all registered EVs in the US as of December 31st, 2021. For that reason, we are comparing our data from 2020 registrations to 2021. In 2023, we will update this list again and compare YOY growth with 2022 registrations.
Note that this data includes BEVs only and does not account for any hybrids or PHEVs.
Current EV registrations in the US, sorted by state
Top three states with the most registered EVs (as of 12/31/21)
- California – 563,070 (+137,770 EVs YOY)
- Florida – 95,640 (+37,480 EVs YOY)
- Texas – 80,900 (+28,710 EVs YOY)
It’s no wonder that these top three states have the most registered EVs since they have some of the highest state populations in the US. They also have some of the highest numbers of registered ICE vehicles and trucks in the US too.
Bottom three states for registered EVs (as of 12/31/21)
- North Dakota – 380 (+160 EVs YOY)
- Wyoming – 510 (+180 EVs YOY)
- South Dakota –680 (+270 EVs YOY)
The bottom three states showcase a similar, yet inverse pattern. These are states with smaller populations and thus fewer vehicles on the road. That being said, Washington D.C. has more than double the number of registered EVs of all three of these states combined.
Despite abysmal numbers in these states, their year-over-year numbers are still encouraging. Each saw at least 54% growth and North Dakota lead this group with a 72.73 % increase YOY.
Top three states who saw the most growth year-over-year (2020 vs 2021)
- Oklahoma (+111% YOY)
- Arkansas (+79.70% YOY)
- Montana (+75.53% YOY)
Overall, EV adoption in the US is growing, state by state, and these numbers above help prove it. Overall EV registrations were up over 42% in 2021 compared to 2020, and every state saw YOY growth of at least 32%, although most were much higher.
Because this data pertains to 2021, we are confident we will see even larger growth when comparing 2022 numbers as the US has recently surpassed the 5% threshold of EV share of the entire market, a number many have labeled as the critical mass tipping point for widespread adoption.
We will need to get through 2022 before we can compare those numbers, but in the meantime, here are some resources to help keep you in the know:
Subscribe to Electrek on YouTube for exclusive videos and subscribe to the podcast.